
Many businesses suffer dwindling patronage because their contact centers do not provide high-quality services. Interestingly, call centers with poor service have something in common – they do not effectively analyze contact center agent performance metrics for actionable insights.
As the famous business quote goes, “if you can’t measure it, you can’t improve it.” If you are not able to understand how your team performs on a daily basis, you won’t know where to begin with consolidating efforts to improve performance.
In this article we identify some of the most important metrics to measure.
Key Agent Performance Metrics
Statistics show that call centers handle about 200 calls daily, with each agent spending about 32 minutes out of an hour talking to customers. With a typical ontact center always a bee-hive of activity, it can be difficult to know how it’s performing without meaningful metrics.
Agent performance metrics are the data points that help you know how your team is handling tasks and achieving goals.
While there’s a wide variety of agent performance metrics, tracking them all is impossible or practical.
The key to success is tracking the right data. You need to know which metrics are important to you and your business and focus on those.
Some of the most important metrics to track are:
First Contact Resolution
First contact resolution (FCR) tracks the percentage of contacts resolved the first time a customer gets in touch.
First Contact Resolution (often called first call resolution) is one of the most straightforward ways to measure performance and productivity.
To get your First Call Resolution rate, divide the total number of customer issues resolved on the first attempt by the total number of issues received in a given period.
The industry benchmark for FCR is 70 – 75%. If your FCR is high, your contact center agents are addressing customer needs the first time around. It means your center will have lower:
- Return contacts. Since customers’ concerns are addressed the first time, they will not need to reach out multiple times.
- Transfer rate. The agent taking the call addresses the caller’s needs, so there’s no need to transfer the call to another agent.
- Escalation rate. The agent addresses the customers’ needs the first time, so the customer will not need to request to speak to a supervisor.
Improving First Contact Resolution has many benefits. The FCR is at the core of a strong customer experience because no customer will want to contact you multiple times or be passed from agent to agent before their concern is addressed. So, FCR is one of the key metrics to track.
Coaching and training and contact agent empowerment are good solutions for improving First Contact Resolution.
Average Handle Time
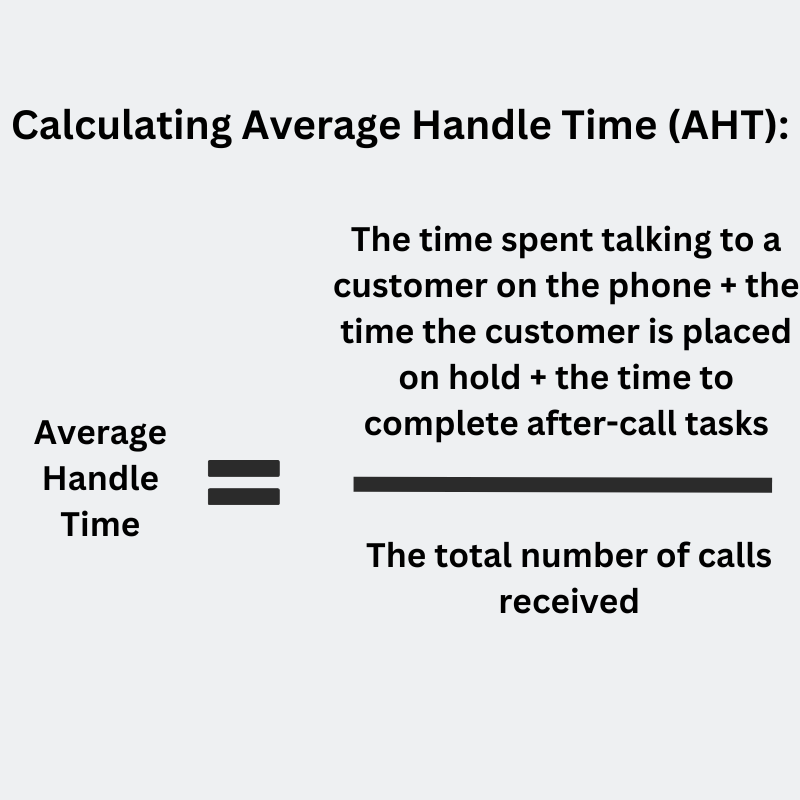
Average Handle Time (AHT) is the average amount of time an agent spends on a customer issue.
Average Handle Time is the average time it takes from when an agent answers a customer’s call to when the agent hangs up the call and completes necessary tasks related to the call. Thus, average handle time includes hold times as well as after-call tasks.
To calculate the Average Handle Time for an agent, sum up the total amount of time the agent spends on the phone talking with customers and performing after-call tasks. Then divide the total by the number of calls the agent handled.
Average handle time is an important performance indicator because customers do not like staying on the phone for ages. However, AHT is a tricky contact center metric because striving to keep calls short can easily compromise the quality of service.
So, while AHT is a good indicator of contact center agents’ efficiency, evaluating AHT on its own is not the best practice. Instead, when tracking AHT, also track other metrics to ensure that your customer service is satisfactory.
While the average handle time for contact centers varies from industry to industry, a Cornell University study shows that the average AHT is around 6.5 minutes.
However, this does not mean you should have a set AHT and expect your agents to resolve customer issues in less or equal time to the set AHT. Instead, ask customer service teams to balance reducing AHT and fully addressing customers’ concerns.
First Response Time
First response time (FRT) is the average amount of time from when a customer submits a request to when an agent responds.
First response time and average handle time make up customer service time. Improving first response time is one of the ways to improve customer service productivity.
It’s easy to see why First Response Time is an important metric to track. Customers seeking answers will not want to wait for long periods before they get a response. For example, no one will want to wait for days before getting a reply to an email inquiry.
A “first response” has to be made by a customer service agent. So, auto-generated responses do not count when measuring the first response time.
The first response time is reported in a period – days, hours, or minutes. The average First Response Time in a period (say one day) is the total first response time in the period divided by the total first responses during the period.
A good first response time varies, depending on the contact channel. For example, good first response times are 45 seconds or less for live chat, 4 hours or less for social media, 3 minutes or less for phone calls, and 24 hours or less for emails.
Tickets Handled
“Tickets handled” is the average number of customer support tickets your contact center handles within a specific time frame.
The “tickets handled” metric refers to tickets your agents open and interact with within a period, but not necessarily the tickets that are resolved and closed.
Thus, “tickets handled” is an excellent metric to track because it shows whether customers are attended to. However, it’s best to pair “tickets handled” with the “tickets solved” metric to show how many of the tickets handled are resolved and closed.
Tickets Backlog
Tickets backlog is the number of unresolved tickets in a particular period of time. The tickets may or may not be open, but they’ve remained unresolved beyond the typical response time set for your contact center.
Many reasons can lead to tickets pilling up in your backlog. These include high ticket volumes, slow support agents, complex inquiries, etc.
This metric can give you an overview of your contact center’s performance. It can help you identify the need for more support agents, additional training, etc.
You should track ticket backlog and strive for a low ticket backlog, which indicates that customer requests are consistently being resolved.
Agent Utilization
Contact center agent utilization is the ratio of agent productivity to their capacity. It is the percentage of productive time spent.
Consider an agent that works on tickets (or on customer calls) for five hours in an eight hours work day. The agent’s utilization is 62.5% (5 productive hours divided by the 8 hours capacity).
Since agent utilization is the percentage of your contact center’s productive time, call center managers can track the metric to improve productivity.
Agent utilization rate provides insight into whether agents are overutilized or underutilized. High utilization means your contact center agents handle more tickets in less time.
However, too high an agent utilization can lead to burnout. Thus, properly managing utilization boosts agent engagement. For example, giving agents high utilization goals may make them feel pressured and unhappy.
Cost per Ticket/Contact
Cost per ticket is the average cost of resolving a ticket. It is calculated by dividing a contact center’s total monthly operating expense by the monthly ticket volume.
A contact center’s operating expenses include:
- Salaries and benefits of contact center agents and indirect personnel (such as administrative staff, supervisors, executives, etc.).
- Cost of technology and telecommunication services (such as software licensing fees, internet costs, etc.).
- Cost of office supplies.
- Part of facilities expenses, including rent, insurance, and utilities.
- Team member travel and courier costs required to fulfill a ticket.
The cost-per-ticket metric will help you understand how your contact center costs affect your bottom line. Thus, you’ll be able to plan better with future budgets.
Cost per ticket is one of the metrics that measure agent performance/ efficiency. Consider two agents that perform the same exact service. If one has a cost of $5 per ticket and the other has a cost of $7 per ticket. The agent with the $5 cost per ticket is more efficient.
Cost per ticket is one of the most important contact center KPIs because a core objective of any business is keeping operating costs down without compromising service.
The more you pay to run your contact center, the less revenue you’ll make. The ideal position for a contact center manager is to achieve customer satisfaction with a low cost per ticket.
Contacts per Agent per Month
Contacts per Agent per Month is the average monthly inbound contact volume divided by the number of agents in the contact center.
When calculating this metric, the contact volume includes inbound contacts from all channels – calls, chat, email, contact forms, office walk-ins, etc.
The “number of agents” is your contact center’s average full-time equivalent agent. If you have two part-time agents whose combined work equals one full-time agent, you’ll count the two part-time agents as one.
Contacts per Agent per Month is a good indicator of agent productivity. Tracking this metric can tell you whether your agents are optimally utilized, your average handling time is poor, your scheduling is effective, etc.
Net Promoter® Score
Net Promoter Score (NPS) is a customer satisfaction indicator that shows the percentage of people satisfied with your customer support service that they’ll recommend your company.
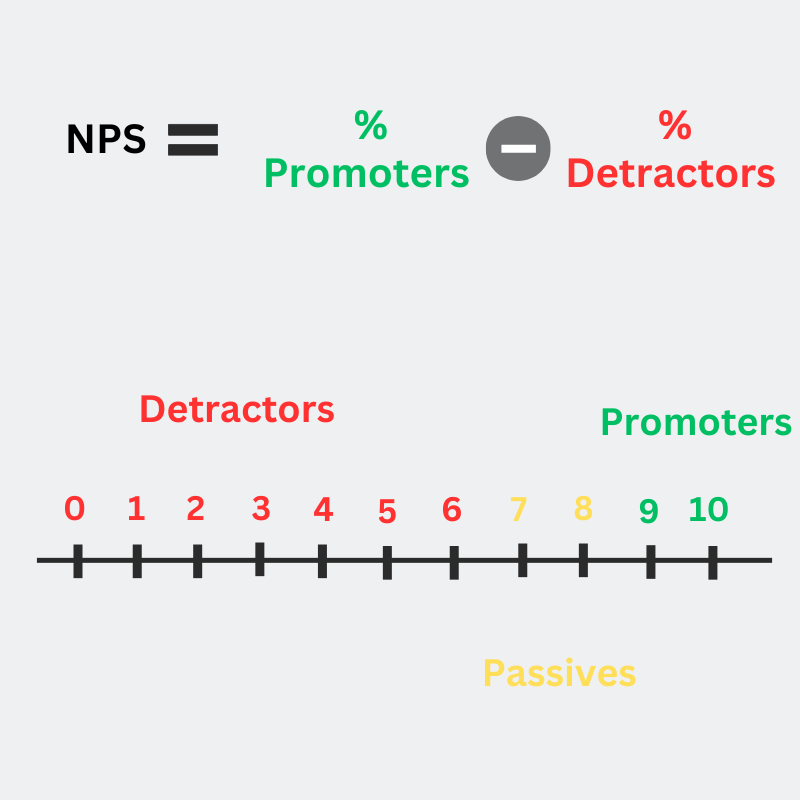
Net Promoter Score measures customer satisfaction and enthusiasm for your service. Calculating NPS starts with asking customers one question: “On a scale of 0 – 10, how likely are you to recommend this company?”
Customers are categorized into three groups:
- Promoters (customers answering 9 or 10 on the scale). Promoters will actively recommend your company and drive your growth through referral flows.
- Passives (customers answering 7 or 8 on the scale). Passives will not recommend your company but will also not cause damage through negative reviews.
- Detractors (customers answering between 0 and 6 on the scale). Detractors will not recommend your business and may even actively discourage others via negative reviews and word of mouth.
NPS is then calculated by subtracting the percentage of detractors from the percentage of promoters.
NPS is a good metric to track because it is a predictor of business growth. A high NPS means you have a good relationship with customers and points to a positive growth cycle. On the other hand, a low or negative NPS means customers are dissatisfied with your customer service.
A low Net Promoter Score by itself paints a partial picture. So, performing a root cause analysis is important to identify the drivers of the low or negative score. For example, the customer’s dissatisfaction may not be with the agent’s performance but with a frustrating company policy.
Customer Satisfaction (CSAT)
The Customer Satisfaction Score (CSAT) measures your customers’ level of satisfaction with your contact center service. It is an important metric because 66% of people care more about a satisfactory experience than price.
The Customer Satisfaction score measures customers’ sentiments toward your company. CSAT also predicts business growth because it determines a customer’s loyalty and lifetime value.
Calculating CSAT starts with a customer experience survey. Customers are asked to rate their level of satisfaction with the support service on a 5-point scale, where 1 is very dissatisfied, and 5 is very satisfied.
CSAT is calculated by dividing the number of customers rating their experience as 4 (satisfied) or 5 (very satisfied) by the number of survey responses.
Like with NPS, CSAT is more valuable when combined with root cause analysis to determine the drivers of poor scores.
For example, an agent could show the best professional behavior, but a customer may be dissatisfied with the service because the product cannot work as expected.
Customer Effort Score
Customer Effort Score (CES) is an indicator that measures your contact center’s ease of use to customers. The CES shows the amount of effort a customer exerts to resolve an issue.
Customer Effort Score (CES) is the third metric most commonly used to measure customer satisfaction (after NPS and CSAT).
Customers generally want a painless process when interacting with your brand. So, the easier the process of getting the help they need, the better customers will rate their experience.
Calculating the Customer Effort Score starts with a survey. Customers are asked to rate the ease of their experience on a five-point scale, where 1 is extremely difficult, and 5 is extremely easy. Thus, a high CES shows that your contact center provides an effortless experience, while a low CES shows that your support service is quite uneasy about using.
Customer Effort Score is a metric worth tracking because it is a predictor of future purchase behavior. Studies show that 94% of customers will repurchase from a low-effort company, while only 4% will repurchase from a high-effort company.
Like the other customer satisfaction metrics, CES gives the best results when combined with analysis to determine the causes of customers’ pain points when using your service. For example, do customers resent having to repeat information, repeatedly being transferred, etc.?
Tracking CES and taking necessary actions to remove obstacles would improve customers’ experience when interacting with your contact center.
The Final Word
Tracking contact center agent performance metrics is key to boosting customer satisfaction. Analyzing your customer service metrics shows you what efforts to consolidate and where you need improvement.
The metrics mentioned above are some of the best to track for contact center success. However, it is not necessary to track all of them. Instead, identify metrics that align with your goals and focus on them.
The KPIs and agent performance expectations need to be carefully evaluated. In many cases, customer dissatisfaction with a contact center does not lie with the agents’ lack of skill or knowledge but with factors such as internal policies, unrealistic service level agreements, etc.
Did you like the post?
You might also like:
Surveypal
Everything you need to lead and improve your customer experience. Learn more at surveypal.com, or


